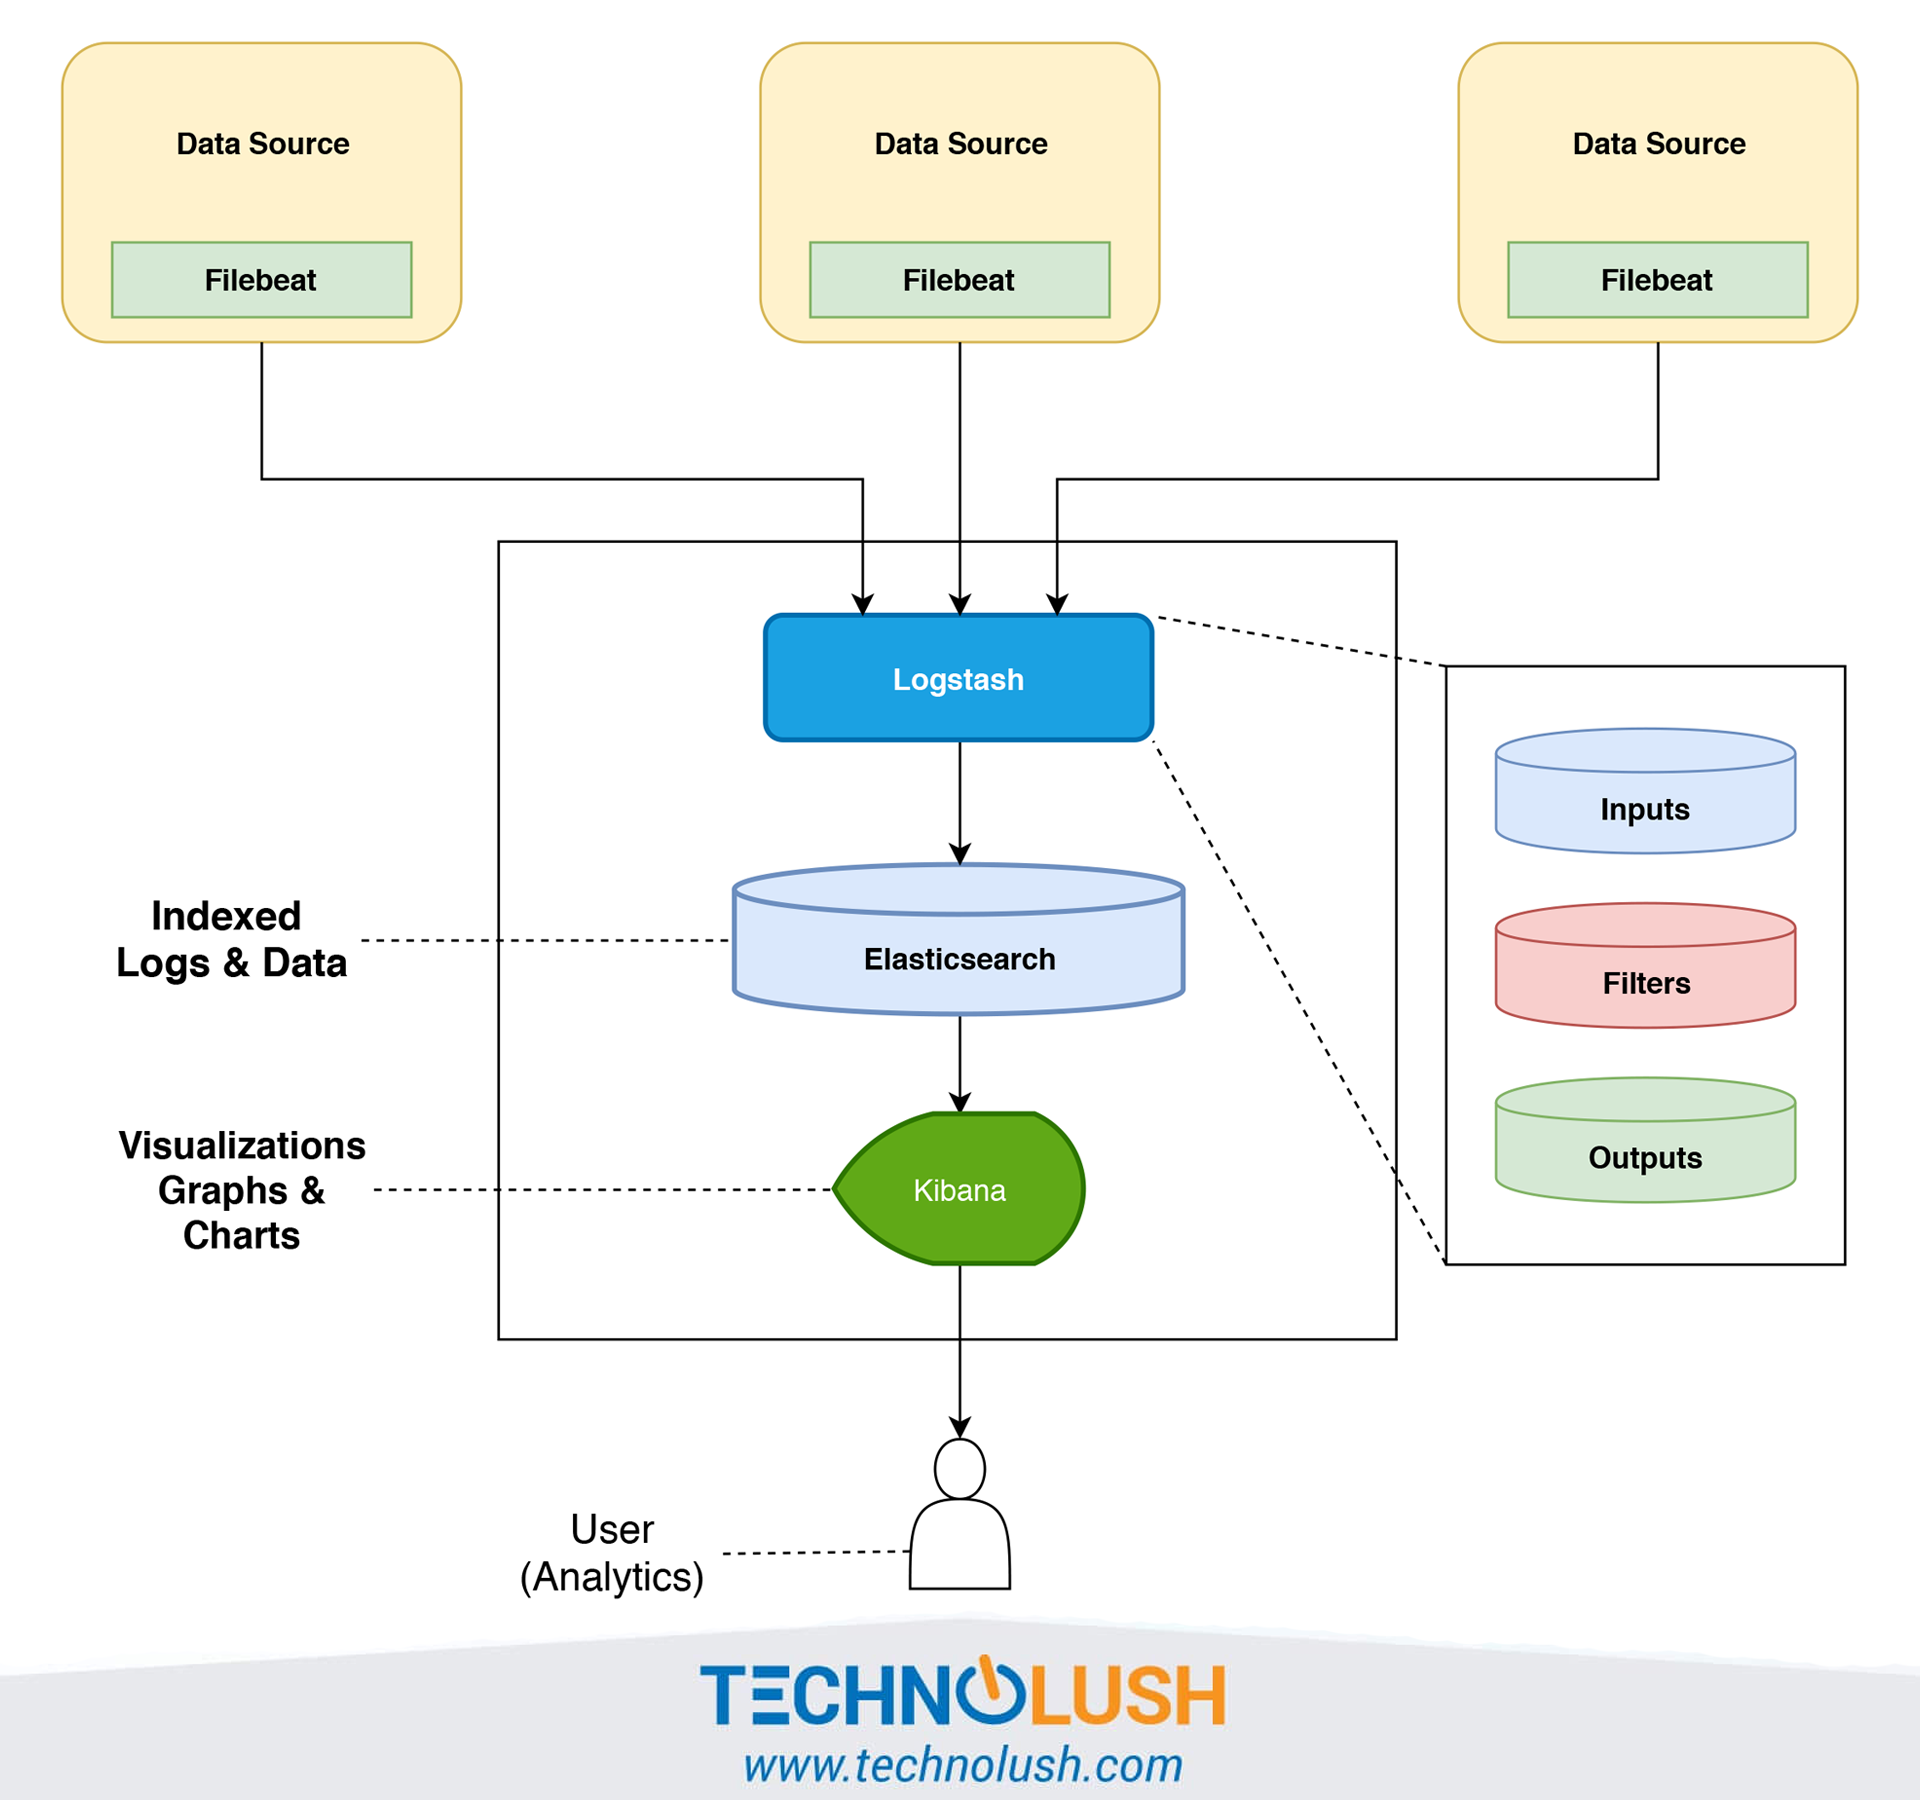
Elasticsearch is among the most popular search engines and it's based on the Lucene library. It's a distributed search engine and provides options to perform RESTful searching. Elasticsearch can also be used as an analytics engine when installed together with Logstash and Kibana.
Elasticsearch, when installed together with Logstash and Kibana, is called ELK Stack. Logstash ingests or collects data from multiple sources simultaneously and transforms or parse the data by following the pre-defined rules to store it in Elasticsearch. Kibana is an advanced visualization tool to visualize the data stored in Elasticsearch using charts and graphs. We can use Kibana to search and visualize the logs indexed by Logstash.
Logstash With Filebeat
The Logstash can directly consume the logs sent by Filebeat installed on the other systems to collectively parse the logs and files from multiple sources to be analyzed by using Kibana. The data flow involved in the ELK Stack using Filebeat is shown above.
Beats Family
Official Definition of Beats - Beats is the platform for single-purpose data shippers. They send data from hundreds or thousands of machines and systems to Logstash or Elasticsearch.
Similar to Filebeat, there are several more from the Beats family. The ELK Stack with Beats is called Elastic Stack. All the data shippers are listed below.
Filebeat - It collects and sends the log files from tens, hundreds, or even thousands of servers, virtual machines, and containers to Logstash. In this way, all the logs and files can be indexed at a central location for analysis and visualization.
Metricbeat - It collects the metrics from systems(CPU, Memory, Disk, etc) and services(Redis, NGINX, Apache, etc).
Packetbeat - It's a lightweight network packet analyzer. It analyzes, collects, and sends the network data to Logstash and Elasticsearch.
Winlogbeat - It collects and streams the Windows event logs to Logstash.
Auditbeat - Similar to Winlogbeat, it collects Linux audit framework data and monitors file integrity.
Heartbeat - It monitors services for their availability with active probing. It keeps track of the status of the services and forwards the live status and response time to Logstash.
Functionbeat - It can be deployed as a function in the cloud provider’s Function-as-a-Service (FaaS) platform like AWS Lambda, Azure Functions, etc to collect, ship, and monitor data from the cloud services.


